To stay on top of important webpage changes, you need a system that can automatically take snapshots of a page and flag any differences. This isn't about manually hitting refresh; it's about using either visual screenshots or the underlying HTML content to catch everything from a competitor's price drop to an accidental change in your site's SEO tags. The real goal is to get alerts on the changes that matter, without getting bogged down by a ton of noise.
Why You Can't Afford to Monitor Manually
Relying on someone to manually check a website for updates is a recipe for disaster. It's slow, prone to human error, and completely impractical in today's fast-moving environment. A competitor can adjust their pricing in an instant, or a new code deployment can silently break your checkout flow. If you're waiting for a human to notice, you're already behind.
Setting up an automated monitoring system fundamentally shifts your approach from reactive to proactive. Instead of finding out about a broken "Add to Cart" button from an angry customer, you get an alert the moment the code goes live.
The Business Impact of Automated Monitoring
This goes way beyond just being a time-saver. For engineering and QA teams, this is the core of visual regression testing—catching UI bugs before they ever make it to your users. For marketing folks, it's a goldmine for competitive intelligence and a critical safety net for SEO.
Think about these real-world situations where automated monitoring is a game-changer:
- Competitive Intelligence: You can automatically keep tabs on your competitors' pricing pages, product launches, or homepage promotions, giving you the data to react quickly.
- SEO and Content Integrity: Get an instant notification if a page's title tag, meta description, or H1 heading is changed without your approval, protecting your search rankings from accidental damage.
- User Experience (UX) Assurance: Confirm that your most important user flows—like login forms, signup pages, or checkout buttons—look and function exactly as they should after every single deployment.
- Compliance and Legal Monitoring: Maintain a verifiable, time-stamped record of any changes to crucial pages like your terms of service or privacy policy.
The stakes are incredibly high. An unnoticed glitch, like a broken call-to-action button or a JavaScript error that stops a form from submitting, directly translates into lost sales and a tarnished brand. Automation is your first line of defense.
This isn't just a niche tool anymore; it's becoming standard practice. The global market for Website Change Monitoring Software is on track to explode to over $2,500 million by 2033. That kind of growth is driven by the sheer necessity of keeping up with the constant churn of web content.
To get a better handle on the strategic thinking behind this, it helps to understand the principles of systematic data observation. This guide on What is a Tracking Plan and why it matters is a great place to start.
Visual vs. Content: Choosing Your Capture Strategy
When you start monitoring a webpage for changes, the first and most important decision you'll make is what to capture. This choice dictates everything that follows—from the kinds of changes you can catch to the insights you'll get. Your two main paths are capturing a visual snapshot (a screenshot) or capturing the underlying content (the HTML or DOM).
Neither approach is inherently better; they just serve different purposes. A visual capture shows you exactly what your users see, making it perfect for spotting UI bugs, branding mishaps, or weird layout shifts. On the other hand, a content capture is your go-to for tracking changes that are invisible to the eye but can have a huge impact, like tweaks to SEO metadata or structural code.
When to Go with Visual Captures
If you need to know what the genuine user experience looks like, a visual screenshot is the only way to go. It captures the final, rendered page with all the CSS, images, and dynamically loaded content in place. For some monitoring tasks, this is non-negotiable.
Think about these real-world scenarios where visual snapshots are king:
- Spotting UI Bugs: A minor CSS update pushes a "Buy Now" button behind another element. An HTML diff probably won't see that, but a visual comparison will scream "broken!"
- Maintaining Brand Consistency: You just rolled out a site-wide redesign. Visual monitoring ensures that logos, color palettes, and fonts look right on every single page, not just the ones you checked manually.
- Catching Third-Party Mayhem: Sometimes, an ad or third-party script goes rogue and wrecks your page layout. A visual check is often the only way to see this kind of problem from a user's perspective.
Visual monitoring is also crucial for catching what I call "non-obvious" changes. Imagine a subtle but important shift in a product image or a broken interactive graph on a financial dashboard. The underlying code might be identical, but the user's experience is completely different. For any QA team, this is the essence of modern visual regression testing.
This flowchart breaks down why automated monitoring is so critical for different parts of a business.
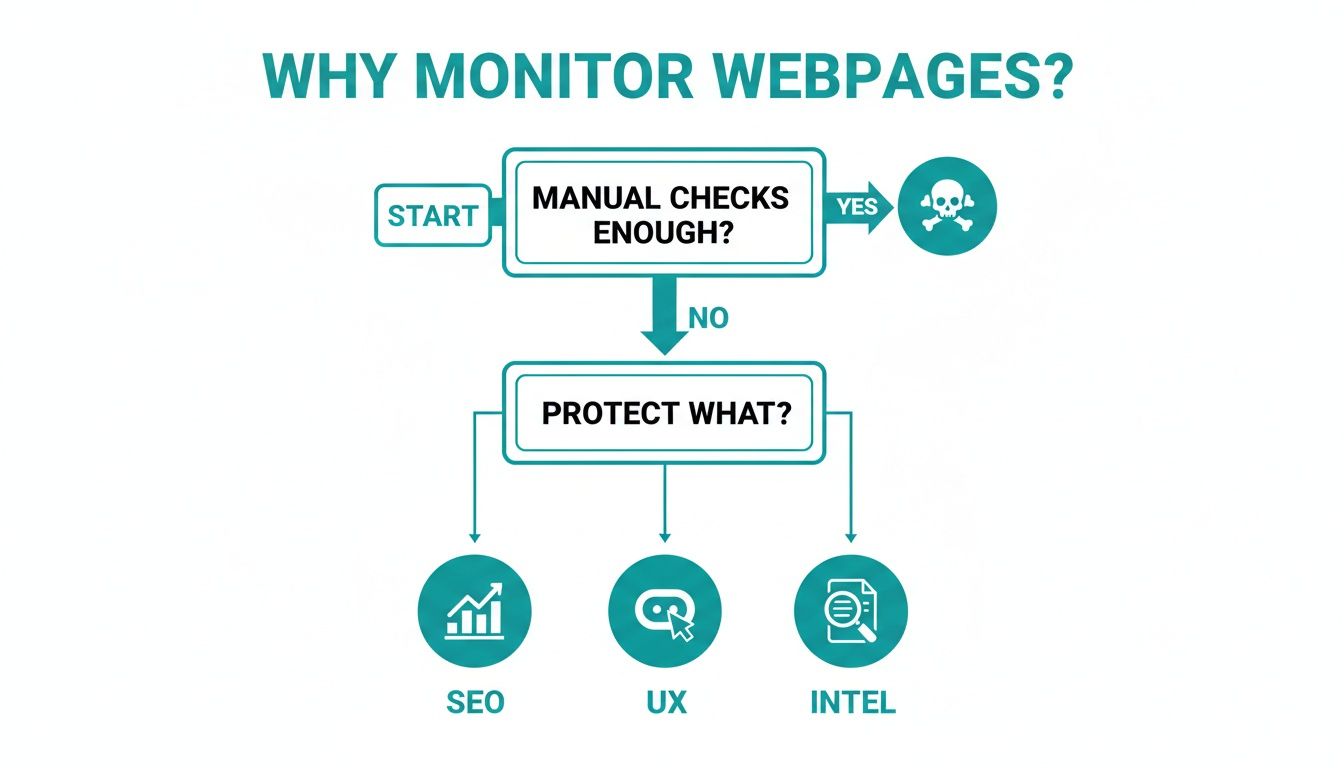
As you can see, once you move past unreliable manual spot-checks, the big drivers are protecting SEO, user experience, and gathering competitive intelligence. Each of these benefits from a different, or sometimes combined, capture strategy.
The Power of Content and Structural Captures
While screenshots are powerful, they can be overkill. Monitoring the raw HTML or the Document Object Model (DOM) is often way more efficient for tracking specific, non-visual data. It's faster and usually creates less noise than a pixel-by-pixel image comparison.
Here’s where content-based captures really shine:
- SEO Monitoring: You can instantly catch changes to crucial metadata like
<title>tags, meta descriptions, orhreflangattributes that have a direct line to your search rankings. - Price and Stock Tracking: If you're doing competitive intelligence for e-commerce, scraping the HTML for a price inside a
<span>tag is far more direct than trying to OCR a screenshot. $49.99 in the code is unambiguous. - API Response Monitoring: Tracking the JSON or XML from an API endpoint is just another form of content monitoring. It’s a lifesaver for detecting breaking changes in your backend services before your users do.
My Takeaway: The best strategy I've seen is often a hybrid one. Use visual captures for your key user-facing pages where the look and feel are everything. For tracking specific data points, SEO tags, or API outputs where you need speed and precision, stick with content captures.
Don't Monitor the Whole Page—Focus on What Matters
Let's be honest: monitoring an entire webpage can be noisy. You get false positives from rotating ads, user-generated comments, or "customers who bought this also bought..." sections. This is where element-level capture saves the day.
Instead of screenshotting the whole page, you can target a specific HTML element—say, the <div> holding a pricing table or the primary call-to-action <button>.
This targeted approach cuts through the noise and ensures your alerts are about changes you actually care about. A good Screenshot-as-a-Service API makes this incredibly easy. You just pass in a CSS selector to isolate and capture one specific part of a page. You get the precision of content monitoring with all the rich context of a visual snapshot. It’s the best of both worlds.
Building Your Automated Capture Workflow
Once you’ve settled on what to capture—visuals or raw content—it’s time to build the engine that does the heavy lifting. The heart of any serious webpage monitoring effort is an automated workflow. This is what turns a tedious manual chore into a reliable, programmatic process that works for you around the clock.
This whole process boils down to setting up a smart schedule, wrestling with the messy realities of the modern web, and making clean, effective capture requests.
Finding the Right Capture Cadence
The first big question you need to answer is about your polling frequency. How often do you really need to check a page for changes? This is a classic trade-off between getting updates the second they happen and not wasting resources.
High-Frequency Polling (every 5-15 minutes): This is for the urgent stuff. Think flash sales on an e-commerce site, breaking news headlines, or a competitor’s stock levels on a hot product. When every minute counts, you poll frequently.
Low-Frequency Polling (hourly or daily): For content that doesn't change on a dime, a daily or even weekly check is plenty. This is perfect for monitoring a competitor's "About Us" page, a legal terms of service document, or a weekly newsletter archive. It’s way more cost-effective and keeps your data storage manageable.
Striking the right balance here is key. Polling too often is just burning money and compute cycles. But polling too infrequently could mean you miss the one change that really mattered. For a deeper dive into this, our guide on how to schedule a website screenshot has some practical examples.
Taming the Modern Web
Let's be honest: modern websites are a far cry from simple, static documents. They're interactive apps, often loaded with dynamic elements that can completely derail a basic capture script. Your workflow has to be tough enough to handle these curveballs.
One of the biggest headaches is cookies and authentication. If you’re trying to monitor a page behind a login—like an internal dashboard or a customer account portal—your system needs to manage session cookies to stay logged in. Otherwise, all you'll capture is the login screen.
Then you have all the pop-ups: cookie banners, newsletter signups, and promotional modals. These things love to get in the way, obscuring the actual content you want to see and triggering false alarms. A simple curl command is useless here. You need a tool smart enough to click "accept" or close the pop-up before taking the shot.
I can't stress this enough: getting a clean, unobstructed view of a page is not a trivial task. This is where a dedicated capture API like ScreenshotEngine is a lifesaver. It automatically blocks most common cookie banners and ads, so you get a consistent, clean capture every single time without having to write your own browser automation scripts.
The sheer scale of the web makes manual checks impossible. With over 1.09 billion sites out there and 252,000 new ones popping up weekly, things change constantly. Bad design choices, found on 84.6% of flawed sites, can cause conversion rates to drop by 38.5%. Even a small change matters, especially when 88.5% of users will ditch a site if it’s slow.
Making Clean and Simple Capture Requests
The good news is you don't need to spin up a fleet of headless browsers yourself. Using a screenshot API distills the entire complex process into a single, straightforward API call. It handles all the browser management behind the scenes, letting you focus on your monitoring logic.
For more specialized use cases, like keeping an eye on market trends, you might even integrate a dedicated competitor price monitoring software. These tools often use the same capture principles but are fine-tuned for a specific business purpose.
Here’s a quick Python example to show just how simple this can be. This snippet calls an API to grab a full-page screenshot and saves it to a file.
import requests import os
Your ScreenshotEngine API Key
API_KEY = os.getenv("SCREENSHOTENGINE_API_KEY") API_URL = "https://api.screenshotengine.com/v1/screenshot" TARGET_URL = "https://example.com"
params = { "key": API_KEY, "url": TARGET_URL, "full_page": "true" }
try: response = requests.get(API_URL, params=params) response.raise_for_status() # Raise an exception for bad status codes
with open("website_capture.png", "wb") as f:
    f.write(response.content)
print("Screenshot saved successfully!")
except requests.exceptions.RequestException as e: print(f"An error occurred: {e}")
This kind of simple, repeatable request is the building block of your entire workflow. By scheduling a script like this to run at your chosen frequency, you can build an incredibly powerful monitoring system without taking on the operational nightmare of managing the browser infrastructure yourself.
Implementing Effective Change Detection and Diffing
Once you've got a system capturing snapshots of a webpage, the real work begins. The next step is comparison—often called "diffing"—which is where you pinpoint exactly what’s different between your old and new captures. The objective isn't just to flag that a page changed, but to understand how it changed in a way that actually matters to you.
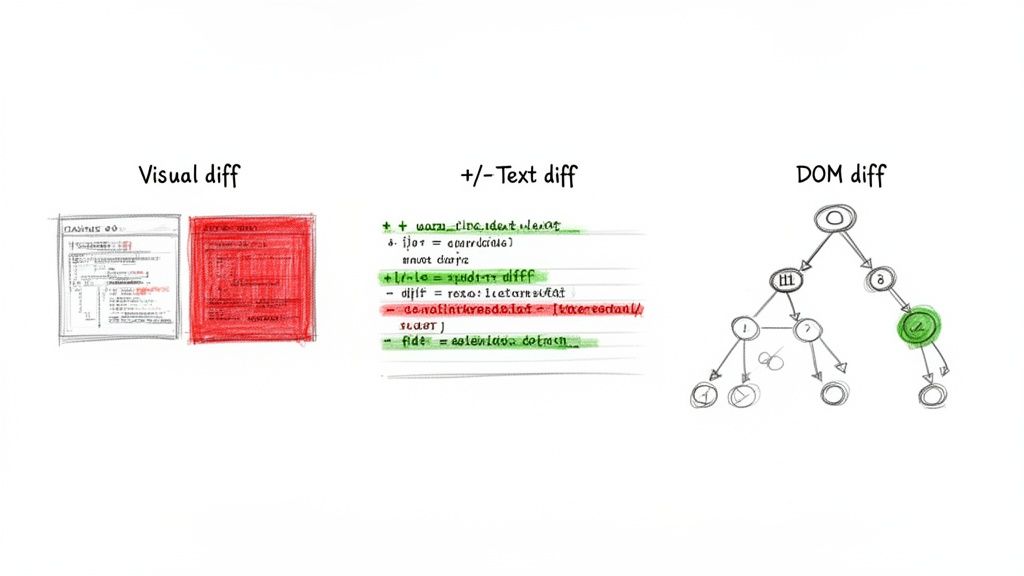
Picking the right diffing method is absolutely critical. A technique that’s perfect for spotting a broken button could be totally useless for tracking SEO metadata. Let's dig into the three main approaches to make sense of your captures and generate alerts you can actually act on.
Visual Diffing for a Pixel-Perfect View
Visual diffing gets straight to the point: it compares two screenshots pixel by pixel. This is the only way to see exactly what a human user sees, catching everything from subtle color shifts and font rendering glitches to major layout bugs and swapped images.
This approach is the bread and butter of visual regression testing. It's brilliant at finding UI defects that code-based comparisons would sail right past. For instance, if a CSS tweak causes text to overlap an image, a visual diff will highlight the mess in bright red, making the problem impossible to ignore.
Plenty of open-source libraries can do the heavy lifting here, like pixelmatch for JavaScript or Pillow for Python. You feed them two images, and they spit out a third "diff image" that spotlights the discrepancies.
But be warned, visual diffing can be overly sensitive. It can easily cry wolf over tiny rendering differences caused by anti-aliasing or ever-changing ad banners. The key is to set a reasonable threshold—a setting that tells the tool to ignore minor pixel variations below a certain percentage. This helps you focus on meaningful visual shifts while filtering out the noise. If you want to go deeper, exploring some of the top visual regression testing tools can offer great insights into managing these challenges.
HTML and Text Diffing for Content Monitoring
Sometimes, you couldn't care less what a page looks like; you just need to know what it says. This is the perfect job for HTML and text diffing. Instead of comparing pixels, this method compares the raw HTML source code or just the extracted text content between two captures.
This method is incredibly efficient and surgically precise for certain tasks:
- SEO Audits: Instantly catch changes to
<title>tags, meta descriptions, or<h1>headings that can make or break your search rankings. - Price Tracking: Pinpoint the exact numerical value of a product's price within a specific HTML element.
- Content Integrity: Get an alert the moment a legal disclaimer, product description, or key article is modified.
Libraries like difflib in Python or diff in JavaScript are fantastic for this. They generate a clear, line-by-line comparison showing exactly what was added, removed, or changed. A crucial step here is HTML normalization. Before you run a comparison, you should strip out whitespace, comments, and other non-essential attributes. This prevents false alarms from meaningless code formatting changes.
Expert Tip: For content monitoring, I often prefer diffing the extracted plain text rather than the raw HTML. This focuses the comparison purely on the visible words, ignoring changes in CSS classes or
<div>structures that don't affect what the user reads.
DOM and Structural Diffing for Layout Changes
Sitting somewhere between visual and text comparison is our third method: DOM or structural diffing. This technique analyzes the structure of the Document Object Model—that tree-like hierarchy of HTML elements—to find changes in how the content is organized.
This approach is powerful for detecting when elements are added, removed, or just shuffled around on a page, even if the text itself stays the same. Imagine a competitor adds a whole new "Features" section to their product page. A text diff might miss it entirely, but a DOM diff will immediately flag the new <section> element.
This is especially handy for:
- Tracking Page Structure: Ensuring critical components like the navigation bar, footer, or checkout form haven't been accidentally deleted or moved.
- Detecting Injected Content: Spotting when a third-party script sneakily adds a new banner or widget to your page.
- Monitoring Complex Web Apps: In single-page applications where content changes without a full page reload, DOM diffing is a great way to track those state changes.
While the tools can be more complex, structural diffing offers a unique perspective. By focusing on the architectural shifts of a page, it gives you a higher-level view than raw text without the pixel-level sensitivity of visual comparisons. Ultimately, the diffing strategy you choose should always circle back to your end goal, making sure every alert is both accurate and actionable.
Creating Actionable Alerting Workflows
So, you've detected a change. That’s the easy part. The real challenge is turning that detection into something useful. A great monitoring system doesn't just spot a difference; it gets that information to the right person, in the right way, at the right time. This is where you graduate from simple change detection to building a smart, actionable alerting workflow.
The last thing you want is to create a system that either floods your team with constant, low-priority pings or, even worse, misses a critical alert because it got lost in the noise. A well-designed workflow transforms raw data into a clear signal, ensuring every important change gets the attention it deserves.
Beyond Basic Email Alerts
Look, a simple email notification is a fine starting point, but it just doesn't scale for a real team. In a crowded inbox, an alert about a broken checkout flow can easily get buried next to a notification about a minor typo. To build a system that actually works, you have to meet your team where they are—integrating alerts with the tools they use all day, every day.
This approach puts alerts directly into the context of their work, making them impossible to ignore.
Slack or Microsoft Teams: This is your go-to for low-to-medium priority changes. Did a competitor tweak some marketing copy? Did a small visual element shift on a landing page? Drop it in a dedicated channel for awareness. It keeps everyone in the loop without derailing their focus.
Jira or Asana: Perfect for changes that demand a tracked response. If your monitor flags a potential UI bug or a broken link, you can automatically create a ticket, assign it to the right engineer, and make sure it doesn't fall through the cracks.
PagerDuty or Opsgenie: Save these for the five-alarm fires. When your system sees that the "Add to Cart" button has vanished or the login form is completely garbled, you need an all-hands-on-deck response. This is when you wake someone up.
Tiering Alerts by Severity
Not all changes carry the same weight. A competitor updating the copyright year in their footer is just noise. But if their flagship product price drops by 50%? That’s mission-critical intelligence. A truly robust alerting strategy hinges on tiered alerting, where the severity of the change dictates the notification channel.
Here’s how a tiered system might look in the real world:
Severity 1 (Critical): The checkout page is visually broken. Action: Trigger a PagerDuty incident that wakes up the on-call engineer. No delays.
Severity 2 (High): The pricing table has new rows or a key call-to-action has changed. Action: Post a high-priority message with a screenshot diff in the
#engineeringSlack channel and automatically create a Jira ticket.Severity 3 (Medium): A minor content update or a small visual shift on a non-critical page. Action: Send a quiet notification to a
#competitive-intelSlack channel for team awareness.Severity 4 (Low): Expected changes, like a blog post update, or tiny text adjustments. Action: Simply log the change in a database or a Google Sheet for the record. No real-time alerts needed.
By categorizing changes, you transform a noisy feed into a prioritized to-do list. This simple act ensures your team's valuable attention stays focused on what directly impacts revenue and user experience.
To help you decide what works best for your team, here’s a quick breakdown of the most common alerting channels.
Choosing the Right Alerting Channel for Your Team
This table compares common notification channels to help you build an effective incident response workflow based on change severity and team structure.
| Alerting Channel | Best For | Signal-to-Noise Ratio | Integration Complexity |
|---|---|---|---|
| Low-priority summaries, reports, non-urgent FYI | Low | Low | |
| Slack / MS Teams | Medium-priority awareness, team collaboration | Medium | Low to Medium |
| Jira / Asana | Actionable tasks, bug tracking, auditable changes | High | Medium |
| PagerDuty / Opsgenie | Critical, revenue-impacting incidents | Very High | Medium to High |
Ultimately, the goal is to match the tool to the urgency. Using PagerDuty for a typo is overkill, but relying on email for a site-down event is a recipe for disaster. Find the right balance.
Managing Your Data Archive
As you monitor pages over time, you’ll build an incredibly valuable historical archive of captures. This isn't just a log of past alerts; it's a rich dataset you can mine for compliance audits, trend analysis, and deep-dive debugging. A clear data management strategy is non-negotiable.
First, you'll need a place to store everything. Cloud buckets like Amazon S3 or Google Cloud Storage are perfect for this—they're cheap, reliable, and scale effortlessly. A simple folder structure organized by URL and date is usually all you need to keep things tidy.
Next, you have to decide on a retention policy. How long are you going to keep these captures?
- Short-Term (30-90 days): This is usually enough for most day-to-day visual regression testing and immediate debugging needs.
- Long-Term (1-7 years): This becomes crucial for compliance reasons, especially for tracking historical changes to legal documents like Terms of Service or Privacy Policies.
This historical data becomes a superpower. It lets you instantly answer questions like, "When exactly did our homepage heading change?" or "Show me what our competitor's pricing page looked like six months ago." Without a structured archive, those valuable insights are gone for good.
Scaling Your Monitoring System
So, your simple monitoring script is working great for a dozen pages. But what happens when you need to track a thousand? Or ten thousand? That's when you hit a wall. A script that handles a handful of URLs will simply fall over at scale. To do this right, you have to stop thinking like a scriptwriter and start thinking like a systems architect.
The first step is to break away from the monolithic design where one process tries to do everything. The real key to scaling is embracing a distributed architecture. A battle-tested pattern here is to use a message queue—think RabbitMQ or AWS SQS. Instead of one big process, your scheduler’s only job is to drop "capture requests" onto the queue. Then, a separate fleet of workers can pull jobs from that queue, do the capture, and run the diff—all independently.
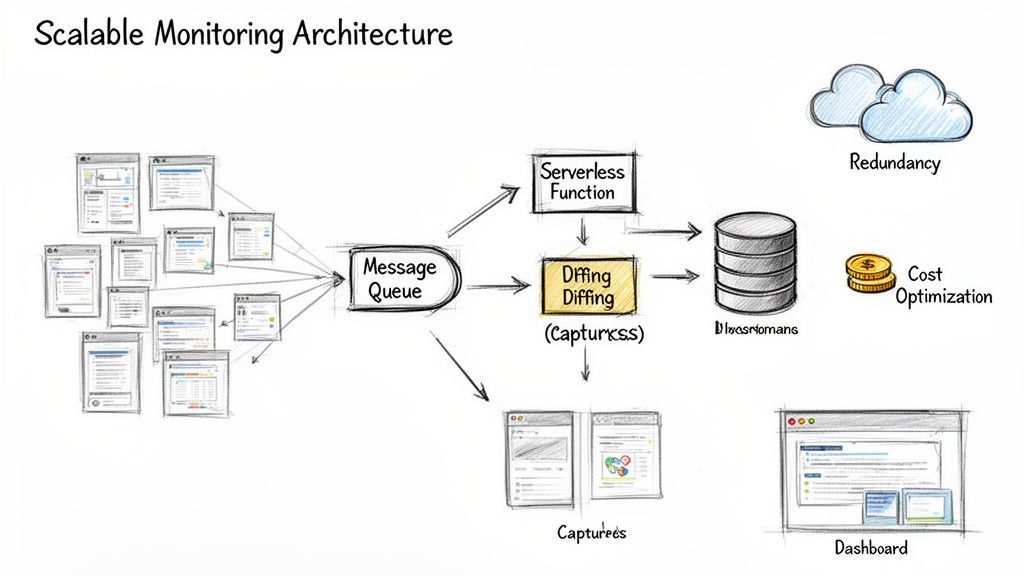
This decoupled approach is a game-changer for flexibility and resilience. If one of your workers crashes mid-capture, no big deal. The job simply stays in the queue, ready for the next available worker to pick it up. You don't lose a thing.
Optimizing for Cost and Performance
Scaling isn't just about handling more volume; it's about doing it without your cloud bill spiraling out of control. Let's be honest: headless browsers are resource hogs. Running thousands of them 24/7 can get expensive, fast. The smartest move you can make is to offload that infrastructure burden entirely.
This is precisely where a managed capture service becomes your best friend. Instead of building, managing, and auto-scaling a complex cluster of browser instances yourself, your system just needs to make a simple API call.
A managed service like ScreenshotEngine takes care of the entire browser lifecycle for you—spinning up instances, blocking cookie banners, handling timeouts, you name it. This frees up your engineering team to focus on the change detection and alerting logic that actually delivers business value, instead of getting bogged down in browser infrastructure.
This approach massively simplifies your architecture and makes your costs predictable. You’re paying per capture, not for a bunch of idle servers waiting for work.
Architecting for Modern Web Complexity
As you scale, you’re going to run into every weird web technology imaginable. Modern pages are incredibly dynamic, with over 60% of traffic coming from mobile and top sites like YouTube getting 71.4 billion visits. A small, untracked change—like a navigation element that suddenly disappears on mobile—can cause user churn to spike by 30.8%. You have to account for Progressive Web Apps and single-page applications, which now make up 20% of enterprise sites. You can get a better sense of the challenges from these in-depth website statistics.
To build a system that can handle this complexity, here are a few architectural patterns I've found essential:
- Go Serverless: Use services like AWS Lambda or Google Cloud Functions to run your diffing logic. They scale from zero to thousands of invocations on demand, and you only pay for the exact compute time you use. It's a perfect fit for the bursty nature of change detection.
- Use Efficient Image Formats: When you're doing visual diffs, don't just default to PNGs. Switching to WebP can shrink your file sizes by 25-35%. Over millions of captures, that translates to massive savings on storage and data transfer costs.
- Build in Redundancy: Don't rely on a single point of failure. If your primary capture mechanism goes down, have a secondary one ready to take over. This could mean having a different API provider on standby or a fallback set of your own self-hosted workers.
Common Questions and Roadblocks
When you first dive into monitoring webpage changes, a few questions pop up almost immediately. Getting these right from the start will save you a ton of headaches and help you build a system that's actually useful, not just noisy.
How Do I Stop Getting False Alarms from Ads and Timestamps?
This is probably the most common frustration. You set up a monitor, and suddenly you're getting alerts every five minutes because a banner ad rotated or a "last updated" timestamp changed.
The most effective way to combat this is to get surgical with your captures. Instead of screenshotting the entire <body>, use element-level capture. Tell your tool to only look at the specific <div> or CSS selector that holds the information you care about, whether it's a pricing table, a product description, or the text of a legal policy. Everything else gets ignored.
Another pro tip, especially for visual diffs, is to account for tiny rendering artifacts. A 1-2% diff threshold is your best friend here. It tells the comparison logic to ignore minor anti-aliasing shifts between captures, flagging only the visual changes that a human would actually notice.
Should I Build My Own System or Use a Service?
This is the classic "build vs. buy" dilemma, and it really comes down to what you want to spend your team's time on.
Going the open-source route with tools like Puppeteer for captures and pixelmatch for diffing gives you ultimate control. You can tweak every last detail. The catch? You're now in the business of maintaining a fleet of headless browsers, and that can become a full-time infrastructure job pretty quickly.
On the other hand, commercial services handle all of that messy infrastructure for you. You just hit an API endpoint, and they deal with the browser scaling, ad blocking, and making sure the captures are reliable. For most teams, this is the way to go. It lets you focus on using the data, not on becoming a browser automation expert.
Ready to build a reliable monitoring workflow without the infrastructure headaches? ScreenshotEngine provides a developer-first API that handles all the complexities of web page capture for you. Start capturing any webpage in milliseconds with our free plan.